Each of these exercises were quick (approximately 5 hours each) explorations in researching and distilling information about COVID-19.
Exercise 1
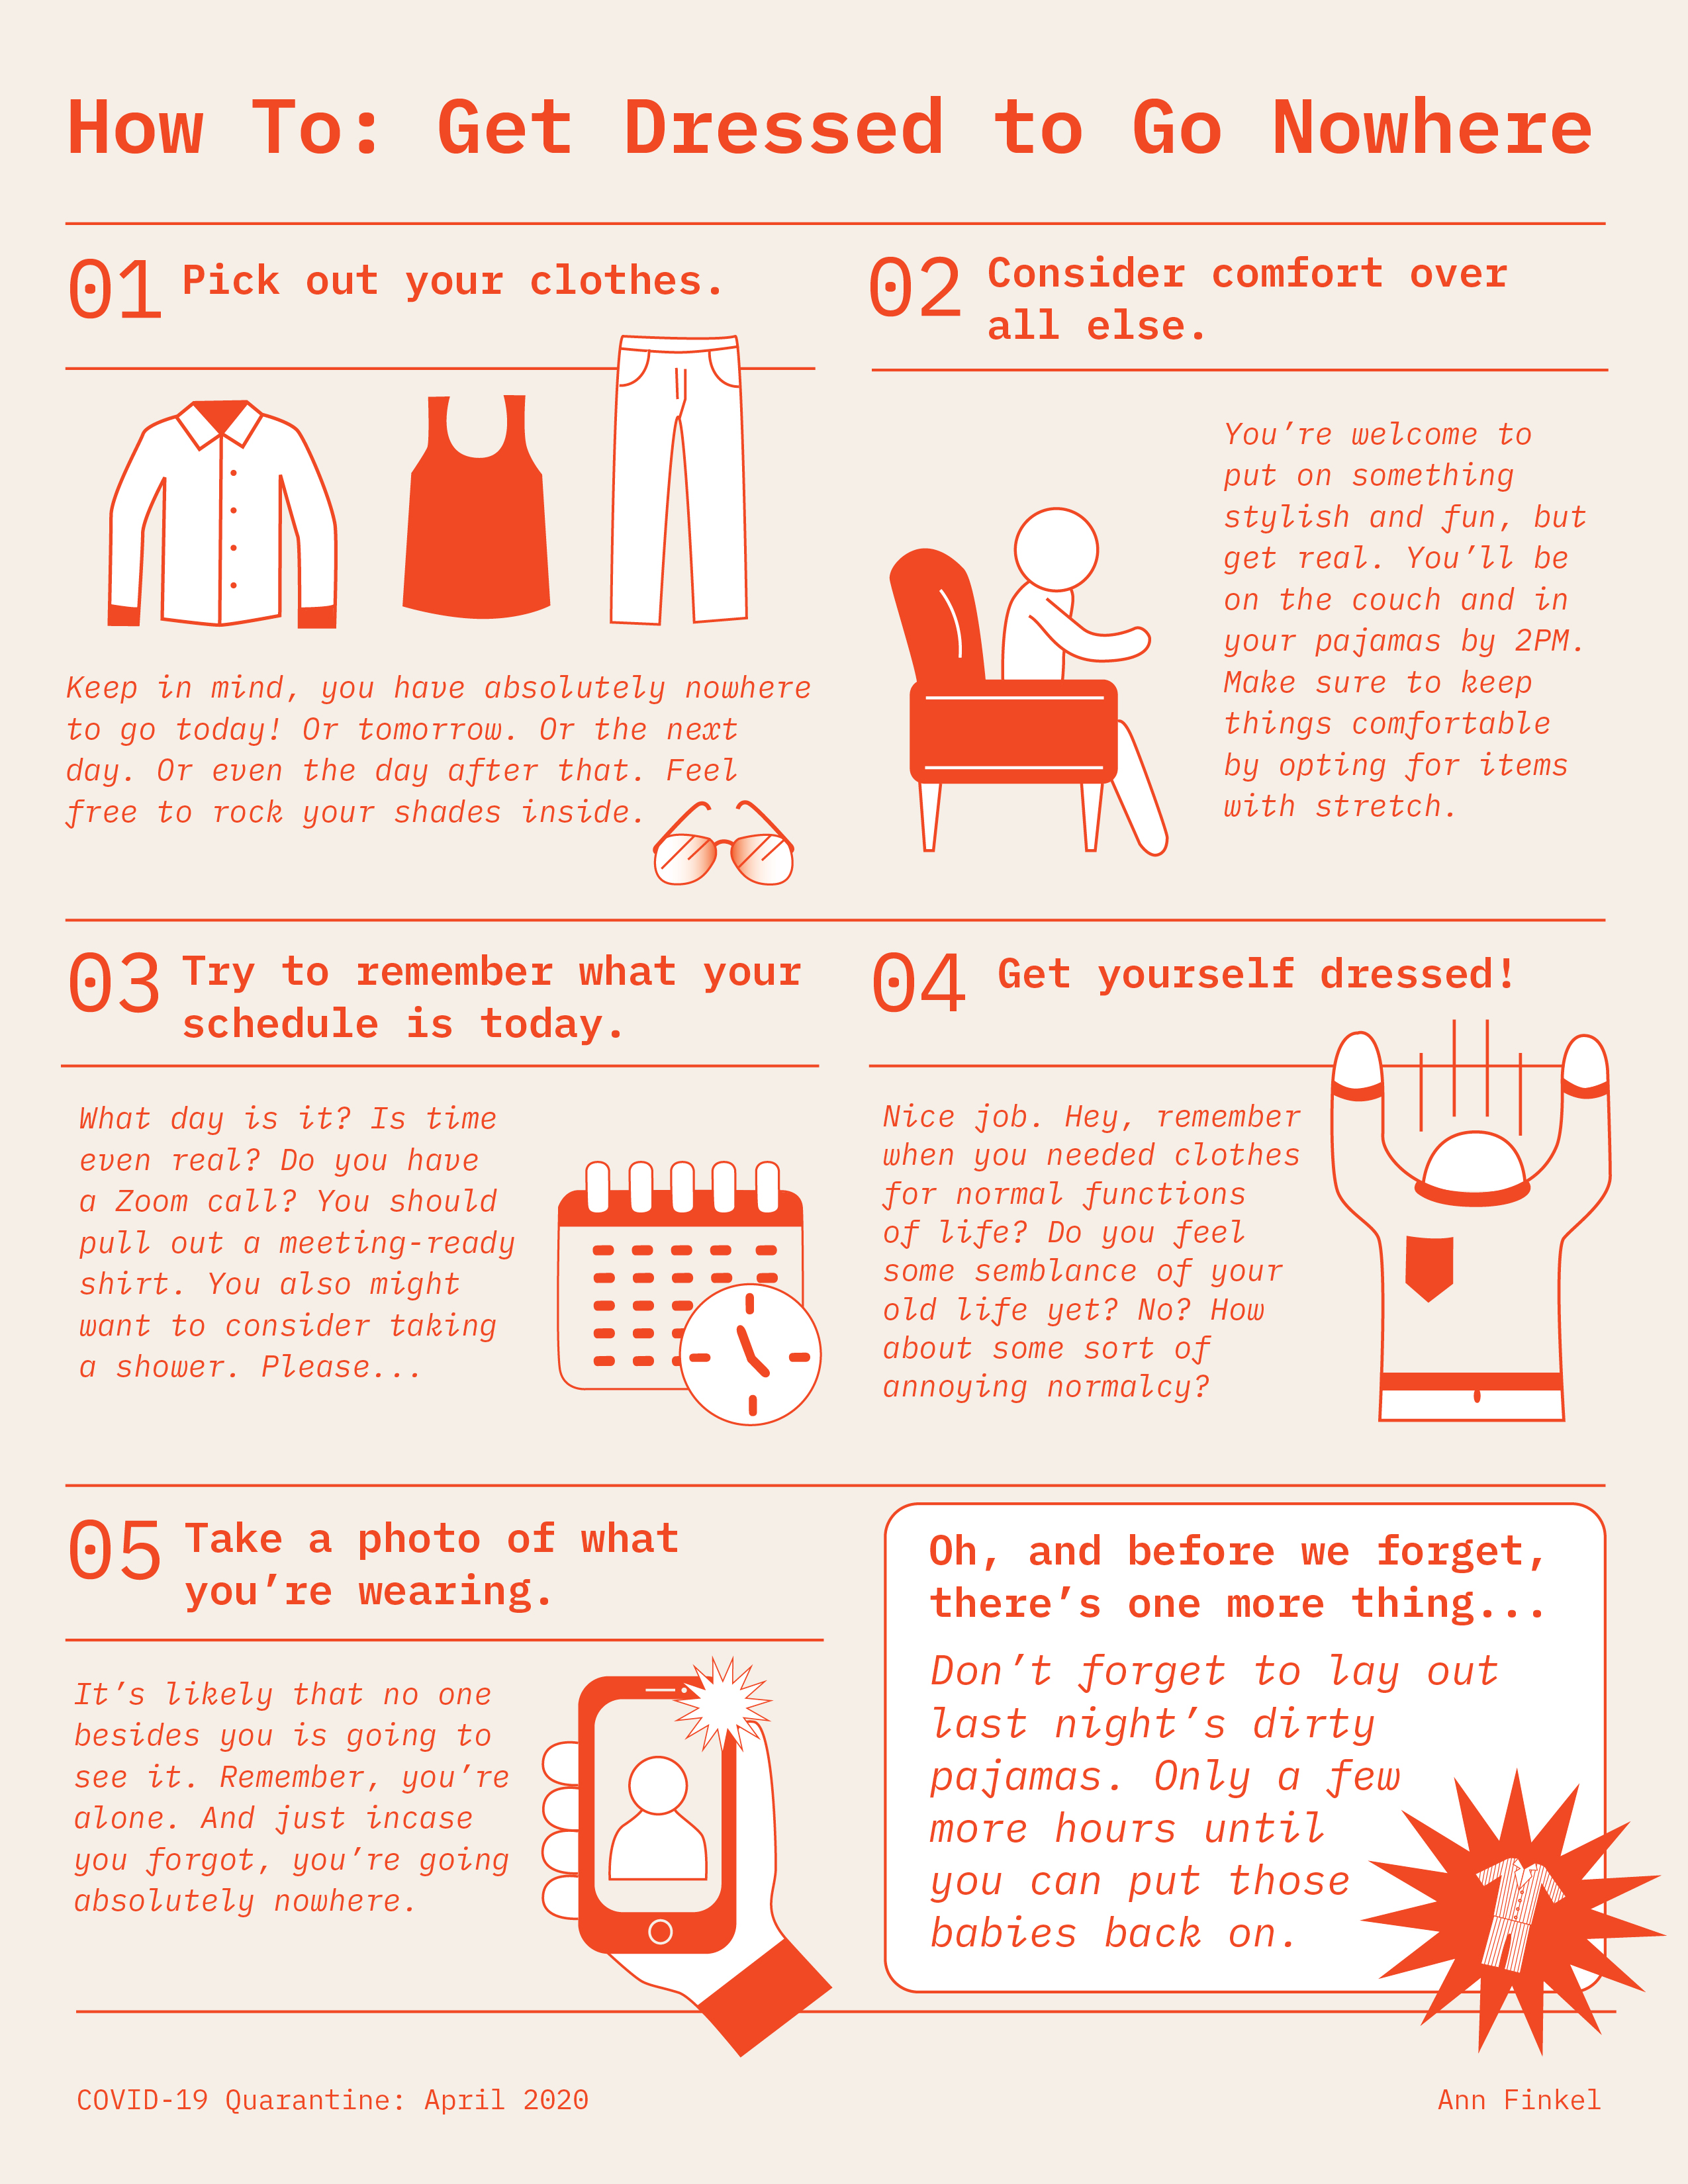
I wanted to play with humor and iconography in this piece. In early quarantine I was faced with the realization that the ritual of getting dressed had completely changed when I didn’t have plans to leave my house. The graphic is letter sized and would likely live as a printed flyer.
Exercise 1
I wanted to play with humor and iconography in this piece. In early quarantine I was faced with the realization that the ritual of getting dressed had completely changed when I didn’t have plans to leave my house. The graphic is letter sized and would likely live as a printed flyer.
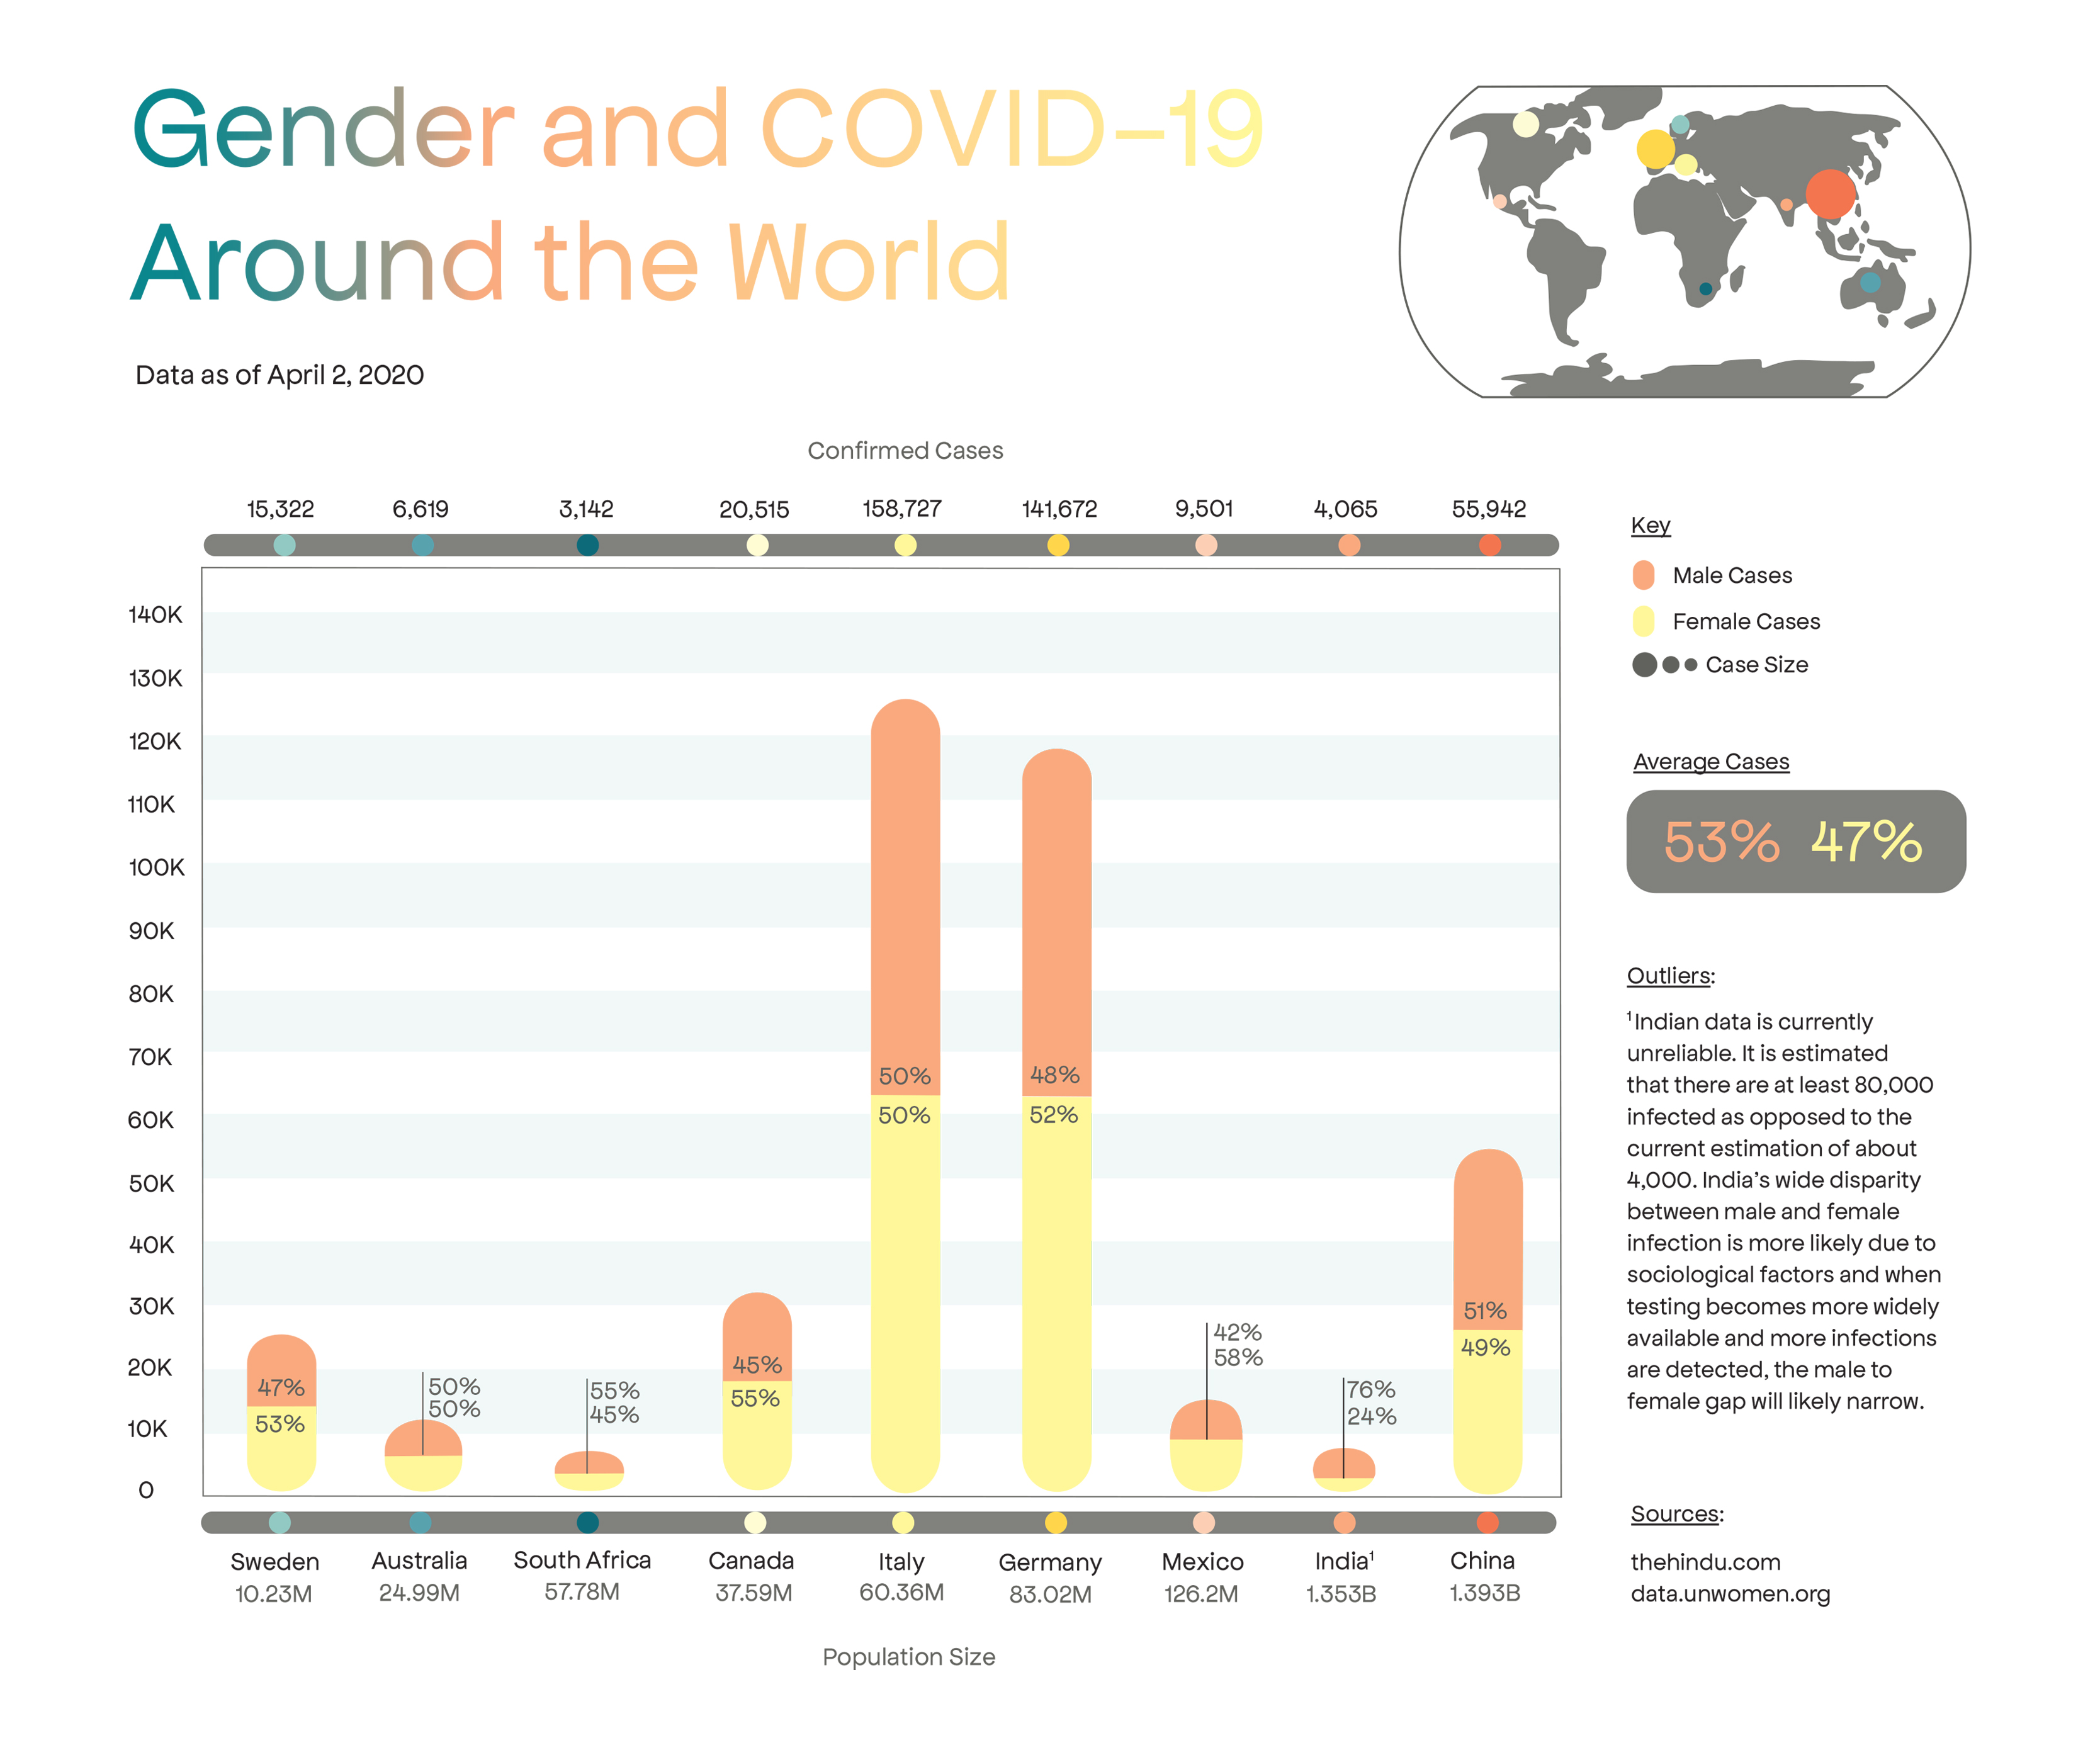
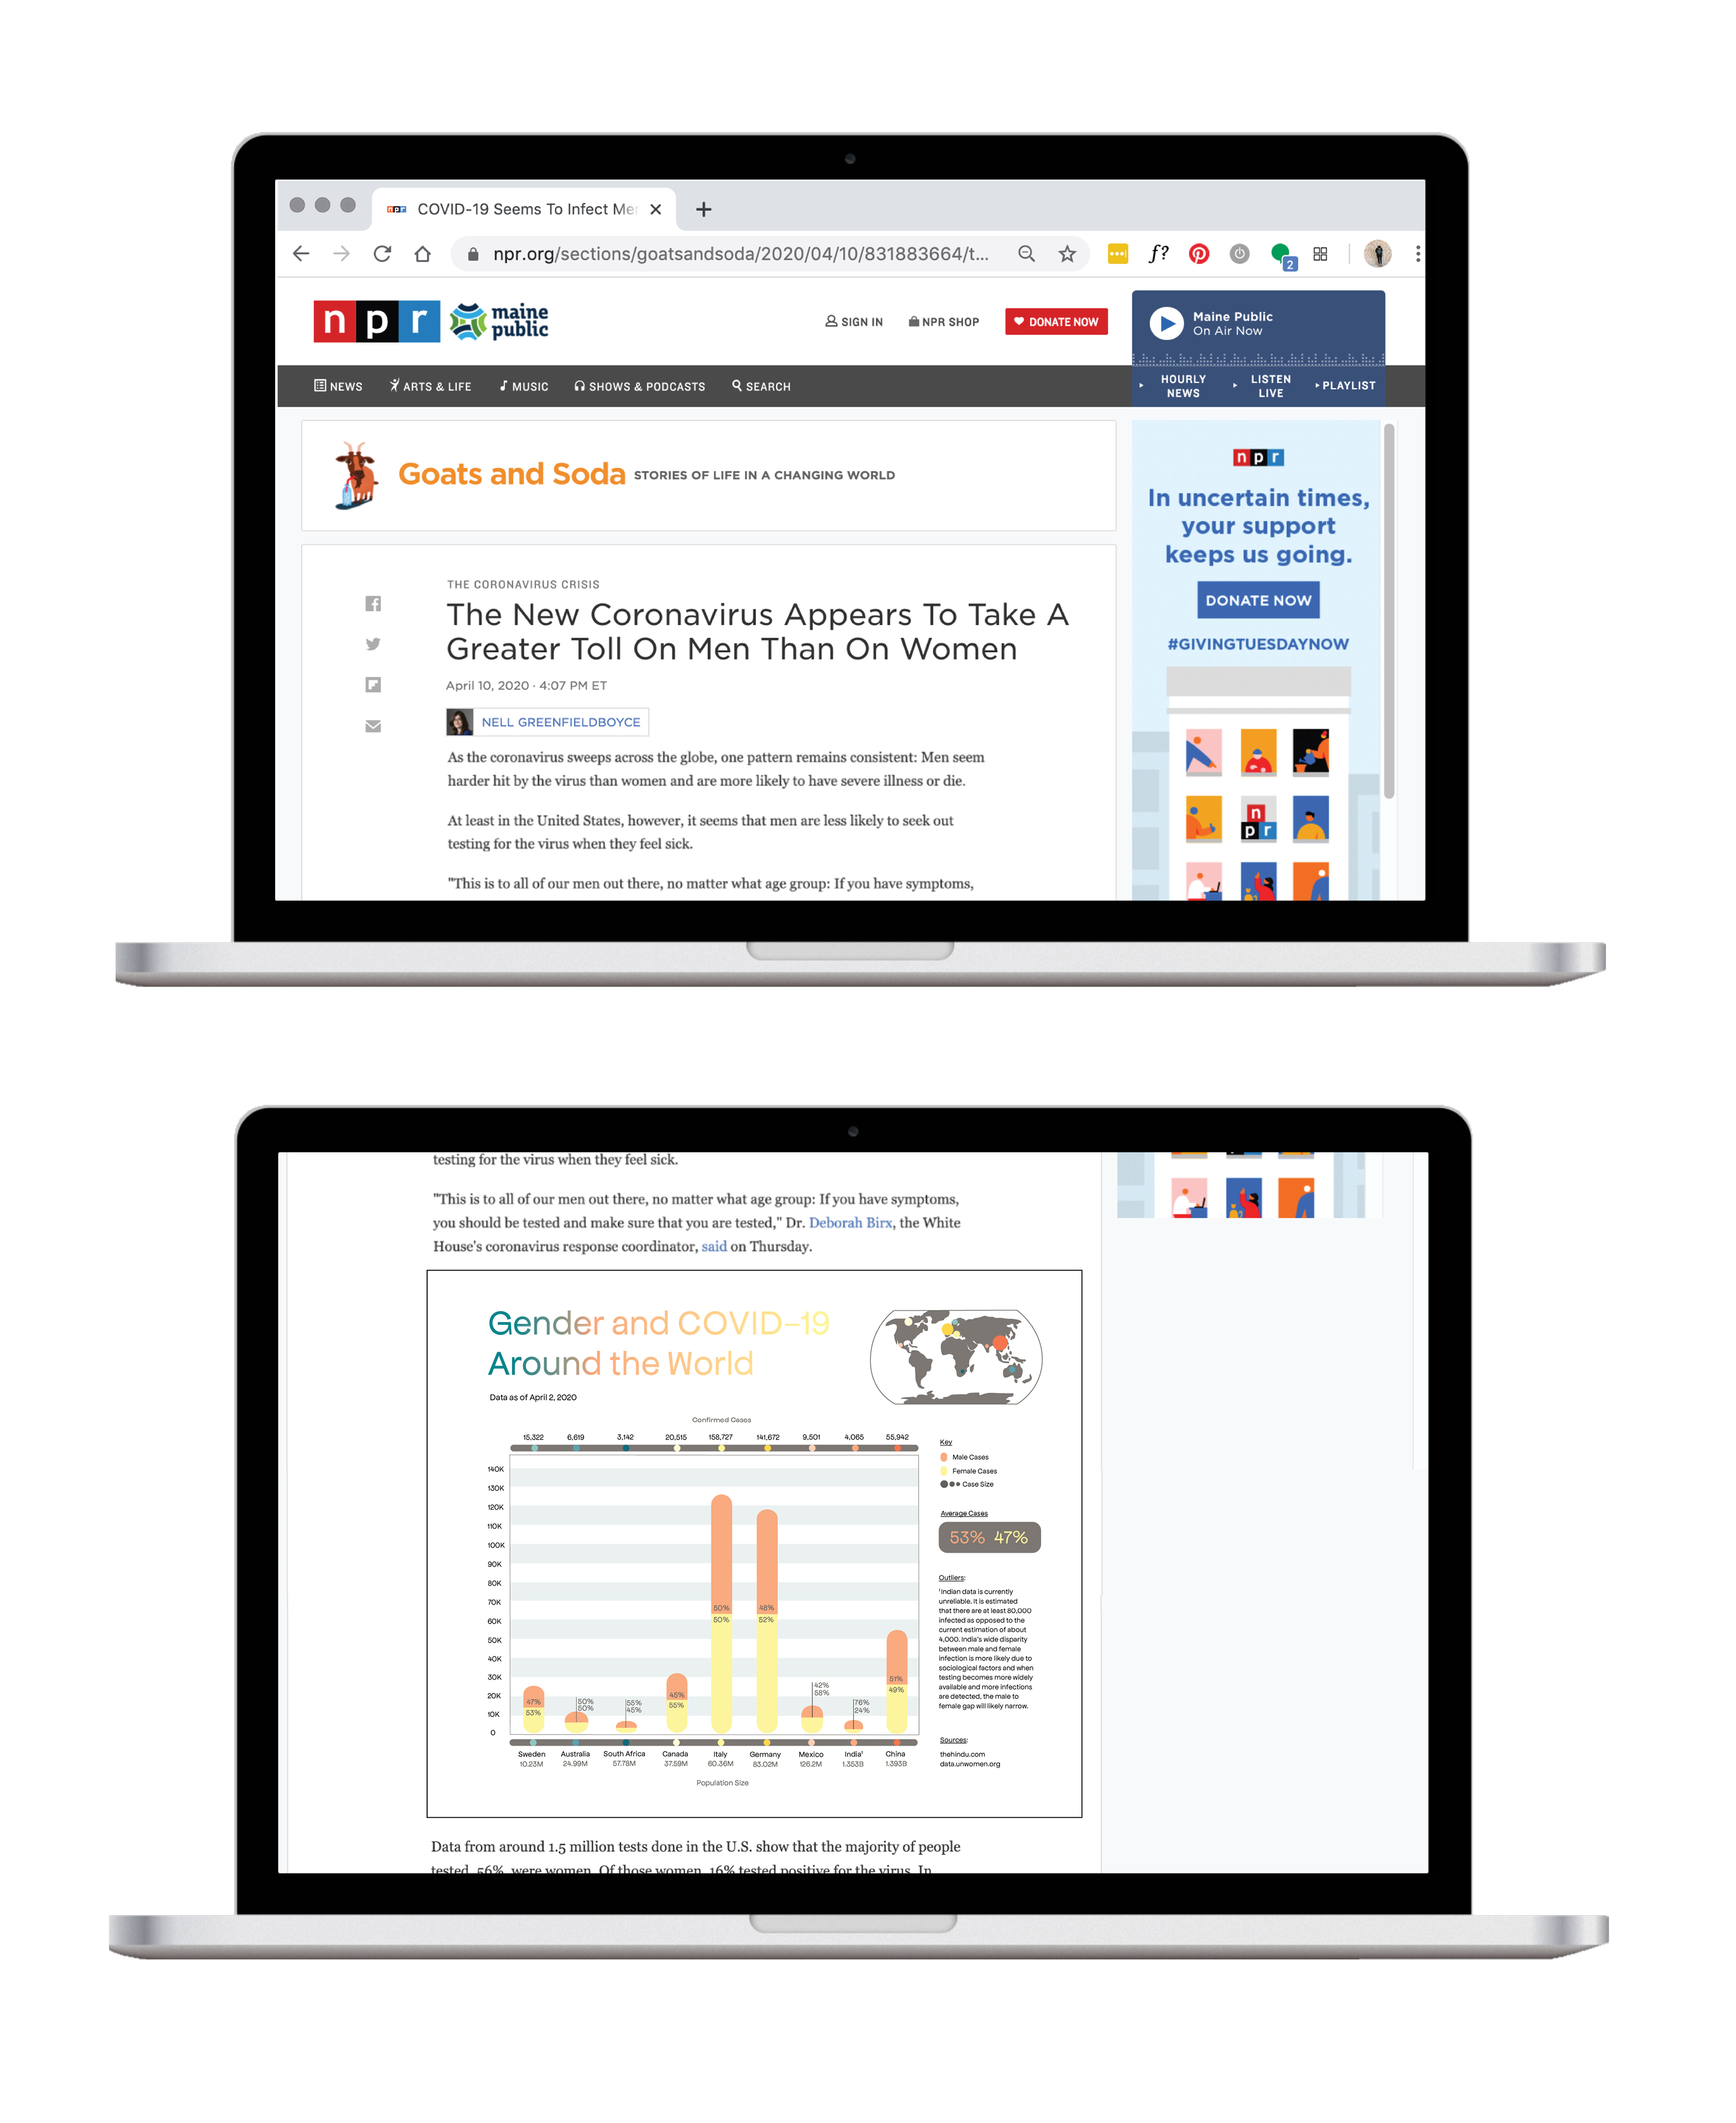
With this graphic, I wanted to explore how COVID-19 affects gender around the globe and show the difference in average cases between men and women. I put the graphic in context below (it would live digitally in a news article).
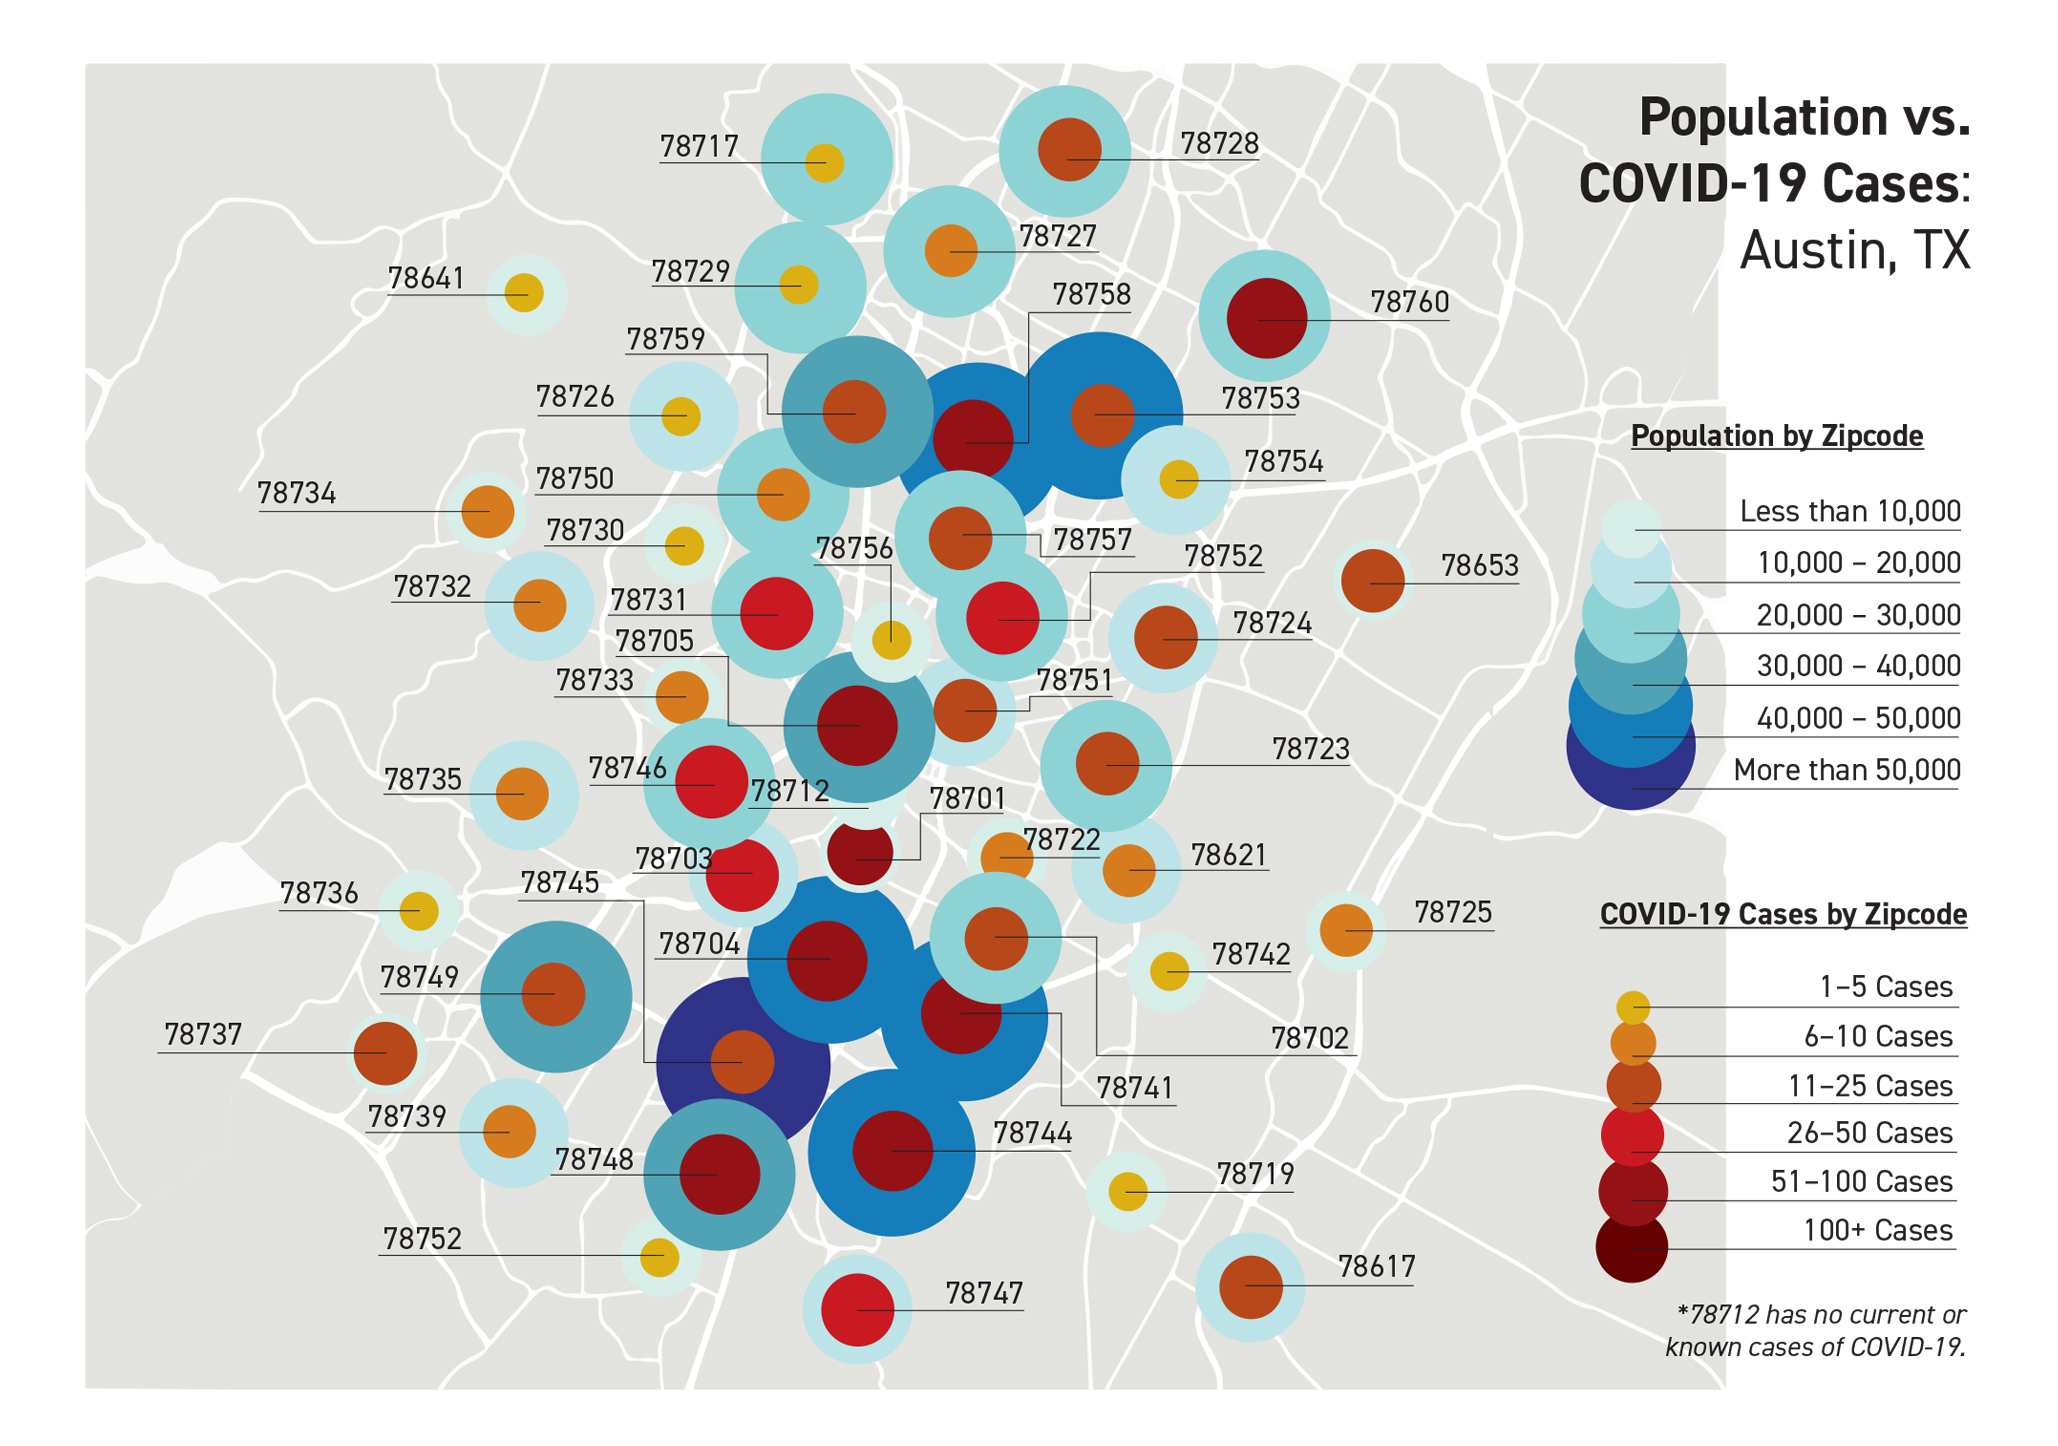
This exercise was the quickest of the three. I wanted to break down COVID-19 cases by zipcode and compare it to population size of said zipcode.